
![]() Are you frustrated by improvement actions that don’t create the level of improvement you expected? Do the problems you’ve tackled continue after the quality improvement (QI) project is completed? One answer to your frustration and disappointment is to understand and apply the concepts and tools of root cause analysis to your problem!
Are you frustrated by improvement actions that don’t create the level of improvement you expected? Do the problems you’ve tackled continue after the quality improvement (QI) project is completed? One answer to your frustration and disappointment is to understand and apply the concepts and tools of root cause analysis to your problem!
W. Edwards Deming, considered the father of QI, transformed quality control processes by applying his beliefs about root cause analysis (Bialek, Duffy, & Moran, 2009, p. 22). 1 His belief was that just measuring outputs and/or outcomes at the end of a work process ignores the root cause of the problems and lingering challenges. Quality can be improved indefinitely and future problems avoided if these root causes are discovered and addressed through ongoing evaluation and QI. All the procedures in an organization should be part of an ongoing measurement process using feedback loops.

The process of building a fishbone diagram enables the QI team to focus on the content of the problem rather than its history or the differing personal interests of team members. In effect, it creates a snapshot of the collective knowledge and consensus of a team around a problem, which builds support for the resulting solutions to the problem.
To construct a fishbone diagram:
- Use a large writing surface such as a flip chart, butcher paper, or a white board.
- Draw a rectangle in the middle of the right-hand side.
- Write the problem statement in the rectangle (not a solution!).
- Draw a horizontal line across the middle of the writing surface from the left-hand side to the middle of the rectangle (like a backbone).
- Draw four to five angled lines outward from the backbone (like ribs).
- Label each rib with a major cause category (see page 25 of Brassard, Ritter, and Oddo [1994] for suggested categories). 2
- Place the brainstormed or data-driven causes in the categories
- Ask repeatedly, for each cause, “Why does that happen?” or “What could happen?”
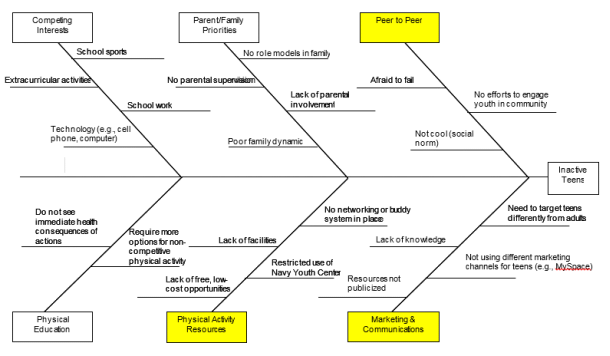
Following is an example of a fishbone diagram created to identify potential root causes for physical inactivity in adolescents.
Once the fishbone diagram has been constructed, the team should interpret or test for root causes by doing one or more of the following:
- Look for causes that appear more than once within or across categories.
- Choose the most likely root causes through an unstructured consensus or a more formal process like multivoting or nominal group process.
- Collect data on selected causes to determine relative frequencies.
- Use an analysis tool, like a Pareto chart, to identify root causes.
Another good tool for finding root causes is called the 5-Whys. This tool is simple to use and is often used in conjunction with the fishbone diagram to delve deeper into a category in the fishbone diagram. The 5-Whys process involves asking “Why?” at least five times in a row and is best used when people do not truly understand the situation or when a deeper understanding is necessary. This tool helps people use higher-order thinking skills to cut through layers of bureaucracy, and encourages people to challenge their current situation or problem.
Although these two tools are commonly used to identify the root cause of a problem, several other tools can be used to approach the problem differently and provide good information for the QI team. These tools include the tree diagram, the affinity diagram, and the interrelationship digraph. Some examples of QI projects on PHQIX that successfully used root cause analysis are described as follows:
| Examples from PHQIX |
|---|
NNPHI Kaizen Program: Processing Low-Priority Chlamydia and Gonorrhea Reports
|
Improving Referral for Hepatitis C Testing in Kittitas County
|
Integrating Chronic Disease and Environmental Health Education into Home Visiting Programs
|
All of the root cause analysis tools mentioned in this article can be found in QI resources such as The Public Health Memory Jogger, the Public Health Quality Improvement Encyclopedia, The Public Health Quality Improvement Handbook, and “Ridding Root Cause Analysis of Defects” (a 50-minute video from ASQ).
1 Bialek, R. G., Duffy, G. L., & Moran, J. W. (2009). The public health quality improvement handbook. Milwaukee, WI: American Society for Quality, Quality Press.
2 Brassard, M., Ritter, D., & Oddo, F. (1994). The memory jogger II: A pocket guide of tools for continuous improvement and effective planning. Salem, NH: GOAL/QPC.
Citation
Mason, M. Root Cause: The Foundation of Successful Improvement. Sat, 08/24/2015, Available at https://www.phqix.org/content/root-cause-foundation-successful-improvement. Accessed 07/03/2024.